Speed and Precision: Velocity Metrics Reshaping Team Success in Baseball, Football, and Hockey
Written by Eden Lange · Jun 9, 2026
Speed and Precision: Velocity Metrics Reshaping Team Success in Baseball, Football, and Hockey
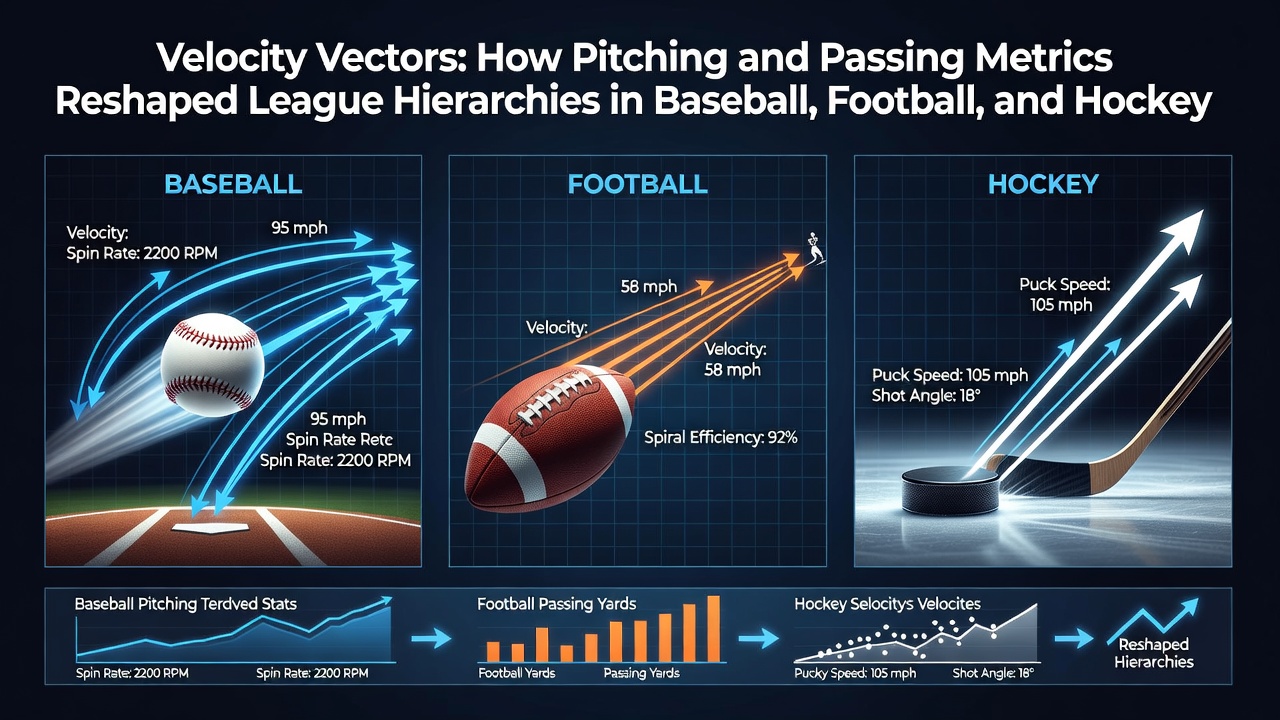
Advanced tracking systems have introduced detailed measurements of throw and shot speeds across multiple leagues, and these velocity vectors now guide roster construction along with in-game decisions in ways that alter competitive balances. Data from radar guns and optical sensors provides precise readings that teams integrate into scouting reports and training programs, which shifts emphasis toward athletes who generate higher speeds consistently.
Baseball's Emphasis on Pitch Velocity
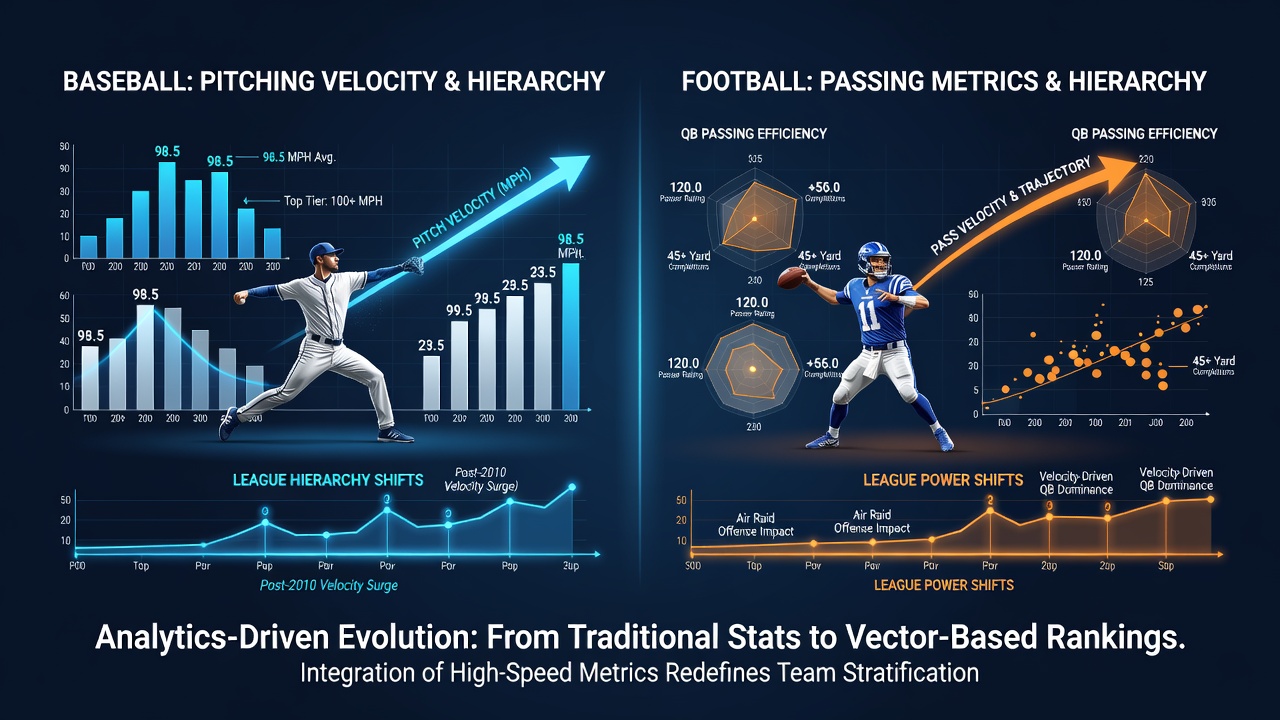
Research shows that average fastball speeds in Major League Baseball climbed steadily through the 2010s and into the 2020s, reaching levels above 94 miles per hour for many starters by the 2025 season. Organizations began prioritizing pitchers who sustain velocities over 95 mph late into games, and this focus contributed to changes in divisional standings as clubs with deeper bullpens featuring high-velocity arms posted stronger records. Studies from the MIT Sloan Sports Analytics Conference indicate that teams allocating higher draft capital to velocity profiles experienced improved win percentages in subsequent seasons, particularly after 2022 when Statcast data became more widely incorporated into front-office models.
Those who've examined franchise trajectories note that certain rebuilding clubs accelerated their rise by targeting relievers capable of touching 100 mph, which created late-inning advantages that older, contact-oriented staffs struggled to match. The ball's in their court for organizations still adapting to these metrics, since data reveals consistent correlations between velocity thresholds and earned run averages across sample sizes exceeding 10,000 innings.
Football Passing Metrics and Quarterback Evaluation
NFL teams now record pass velocity during combine testing and regular-season snaps, and this information influences draft positioning for signal callers whose throws exceed 55 mph on average. Evidence suggests that offenses built around high-velocity passers achieve greater yards per attempt in downfield situations, which has reordered playoff seeding in several conferences since the expanded analytics programs rolled out after 2020. Observers note that franchises investing in quarterback development programs centered on arm strength metrics often climb divisional standings faster than those relying on traditional accuracy measures alone.
Figures from league tracking partners show that interceptions drop when velocity combines with improved release timing, allowing teams to sustain drives that convert into higher point totals. One case where experts found measurable impact involved a mid-tier club that acquired a prospect posting elite velocity readings, and within two seasons that addition aligned with a jump from last place to a division title contention window.
Hockey Shot and Pass Velocity Applications
In the NHL, puck tracking technology measures both shot speeds and pass velocities, and teams apply these vectors to evaluate defensemen and forwards who create high-danger chances through speed of execution. Data indicates that clubs emphasizing players with average slapshot velocities above 95 mph on the power play have recorded elevated goal differentials during regular-season play, particularly in the 2024 through 2026 campaigns. Research conducted at the University of British Columbia highlights how integrated velocity analytics helped certain Canadian franchises refine their transition game, resulting in improved standings positions relative to peers slower to adopt the tools.
What's interesting is that European scouting networks began incorporating similar data streams earlier, and this head start allowed some international prospects to enter North American leagues with already refined velocity profiles. Those who've studied this know that shot velocity alone does not guarantee success, yet when paired with accuracy readings the combined metrics correlate with higher expected goal values across thousands of tracked sequences.
League-Wide Effects on Competitive Balance
Across baseball, football, and hockey, adoption of velocity-based scouting has coincided with shifts in how resources get allocated during drafts and free agency periods. Teams that integrated these measurements earlier often secured advantageous positions in their respective hierarchies, while slower adopters faced steeper climbs to regain ground. According to reports compiled by international sports federations, the emphasis on measurable speed outputs has also influenced training regimens at youth levels, which feeds a pipeline of athletes pre-conditioned to meet professional velocity benchmarks.
But here's the thing: the same datasets that elevate certain clubs can expose vulnerabilities when opponents exploit predictable high-velocity tendencies. Analysts continue to refine models that weigh velocity against other variables such as movement and deception, ensuring that hierarchies remain fluid rather than static even as measurement precision increases through June 2026 and beyond.
Conclusion
Velocity vector analysis has become a standard component of performance evaluation in these three sports, and its integration continues to influence which organizations occupy top positions in league standings. Continued refinement of tracking systems promises further adjustments to roster strategies as new data streams emerge, maintaining the dynamic nature of competitive structures across professional circuits.