Road Weary Circuits: Tracking Travel Loads and Fixture Density Against Output Stats in Elite Leagues
Written by Rafael Richter · Jul 14, 2026
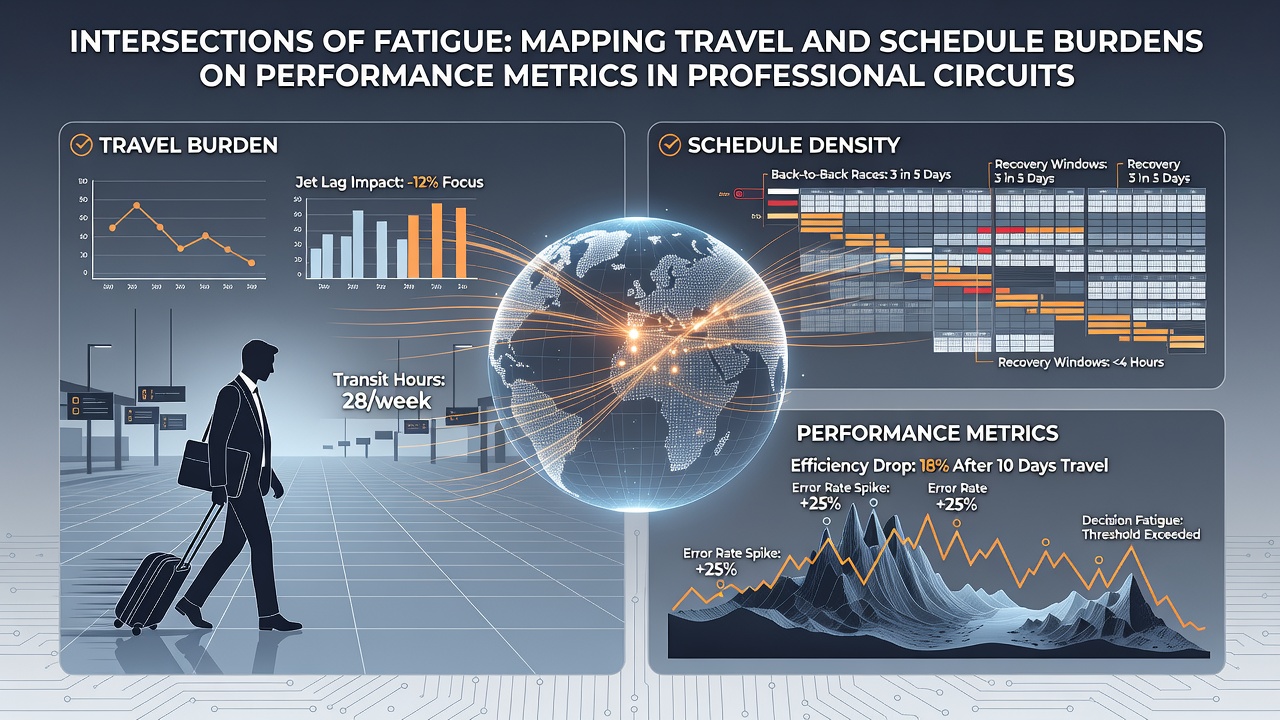
Road Weary Circuits: Tracking Travel Loads and Fixture Density Against Output Stats in Elite Leagues
Professional sports leagues operate under dense calendars that force teams across time zones and back-to-back commitments, and performance metrics reflect those pressures in measurable ways. Researchers from multiple continents have documented how cumulative travel distance correlates with drops in shooting accuracy, sprint volume, and recovery markers across basketball, football, hockey, and soccer schedules.
Data sets compiled by league analytics departments show that NBA teams logging more than 40,000 air miles in a single season post lower offensive efficiency on the second night of back-to-backs compared with rested opponents. Similar patterns appear in European soccer where clubs crossing multiple time zones for Champions League midweek fixtures then face domestic league matches within 72 hours.
Cross-League Patterns in Schedule Density
Analysts at the Australian Institute of Sport examined fixture lists from the AFL, NRL, and A-League and found that teams traveling more than 2,000 kilometers between rounds recorded elevated heart-rate recovery times the following week. Those same clubs showed reduced high-intensity running distances tracked by GPS units during the subsequent match. Observers note comparable trends in Major League Baseball where West Coast clubs playing East Coast series followed by immediate cross-country flights exhibit measurable declines in on-base percentages during the next series.
The NHL schedule matrix produces its own signature burdens because of the league's geographic spread and frequent four-games-in-six-nights stretches. Performance databases maintained by the league indicate that teams completing coast-to-coast trips register fewer blocked shots and lower save percentages in the immediate aftermath, while penalty minutes rise slightly as fatigue accumulates.
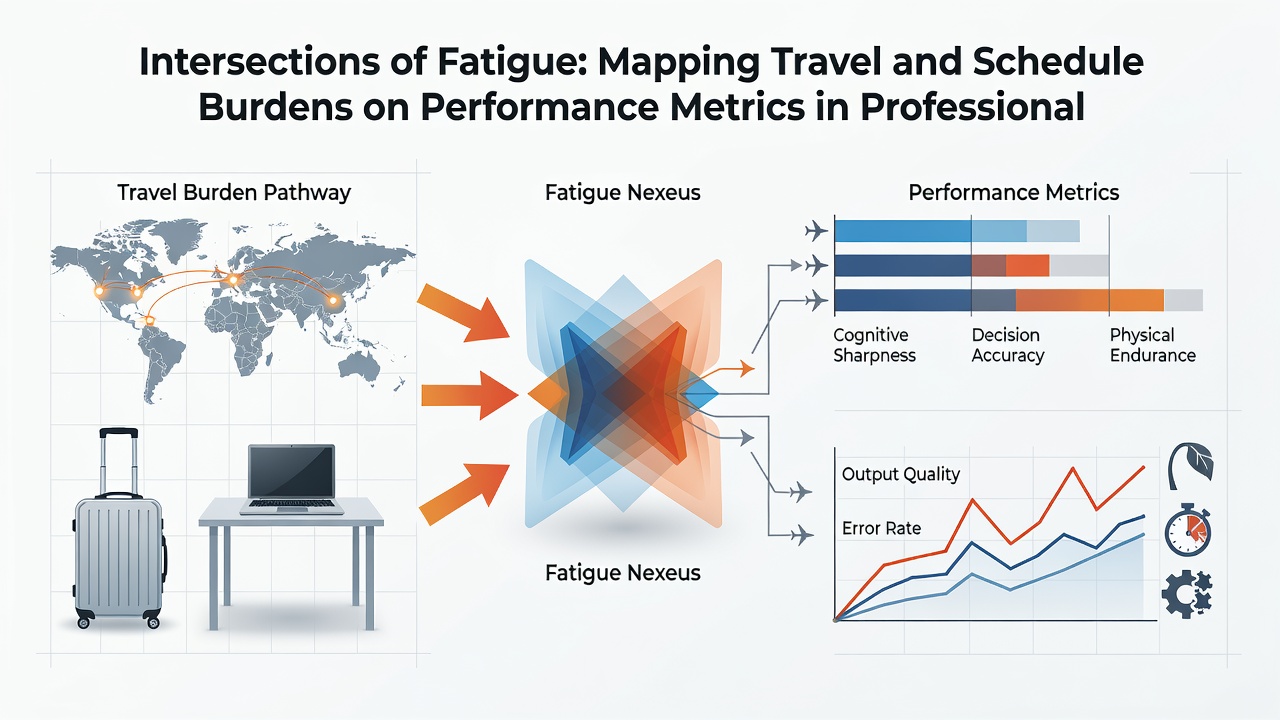
Physiological Markers and Metric Shifts
Studies conducted at Canadian universities have tracked salivary cortisol and actigraphy data from athletes during extended road trips and discovered that sleep fragmentation rises sharply after eastward travel across three or more zones. Those physiological changes align with documented reductions in reaction time and decision-making speed captured by on-ice and on-court tracking systems. European researchers working with UEFA clubs reported parallel findings when examining match-running data from teams that played Sunday domestic fixtures followed by Wednesday continental contests.
Performance dashboards used by front offices now incorporate travel-adjusted expected metrics that adjust for distance flown, time-zone differential, and days between games. These models reveal that certain positions suffer more pronounced effects; perimeter players in basketball and wide forwards in soccer display steeper declines in high-speed efforts than interior positions that experience less lateral movement demand.
July 2026 Scheduling Outlook
League offices preparing calendars for the 2026-27 seasons have begun integrating fatigue-mapping tools earlier in the process. July 2026 marks the window when several North American leagues finalize their interlocking schedules with international tournaments, and preliminary models already flag potential clusters of compressed travel for teams participating in both club and national-team windows. Data shared between the NBA, NHL, and MLS indicates that early incorporation of recovery buffers reduces the frequency of high-burden sequences that previously correlated with elevated injury reports in subsequent months.
Recovery Interventions and Metric Responses
Clubs have introduced structured interventions such as chartered flights with optimized cabin pressure, dedicated sleep coaches, and variable training loads keyed to travel history. Longitudinal tracking from one Premier League side showed that players who followed individualized post-flight protocols maintained closer to baseline passing completion rates in the 48 hours after long-haul travel than teammates who followed standard schedules. Similar adjustments in MLB clubhouses have coincided with stabilized slugging percentages during the second game of West Coast swings.
Academic collaborations continue to refine these approaches. Research groups in Scandinavia and Japan have published joint papers examining how light-exposure timing and meal scheduling can blunt the performance decrements associated with rapid time-zone shifts, and league medical staffs have begun testing scaled versions of those protocols during summer training camps.
Conclusion
Performance databases across major circuits now treat travel volume and fixture compression as quantifiable variables rather than background noise. As schedules grow more interconnected with global events, the mapping of these burdens against output statistics supplies front offices and medical staffs with clearer signals for load management decisions that directly influence on-field results.