Performance Data Shifts Linked to Cross-Timezone Travel in Professional Sports Leagues
Written by Eden Lange · Aug 23, 2026

Performance Data Shifts Linked to Cross-Timezone Travel in Professional Sports Leagues
National circuits in basketball, baseball, hockey and football have long tracked how cross-timezone journeys influence on-field output, and researchers continue to compile detailed journals that pair travel logs with statistical records. These documents reveal consistent patterns in metrics such as shooting percentages, sprint speeds and error rates when teams move between Eastern, Central, Mountain and Pacific zones. Data collected through league databases and independent monitoring programs show measurable dips in several categories during the first 48 hours after arrival, while recovery trajectories vary by sport and individual preparation routines.
Travel Patterns Across Major Leagues
League schedules place teams on the road for stretches that cross multiple time zones several times each month, and analysts log departure times, flight durations and arrival clocks alongside game results. NBA teams average more than 40,000 miles per season according to internal travel summaries, whereas MLB clubs log even higher totals because of longer regular-season calendars. Observers note that westward flights tend to produce sharper initial declines in evening performance indicators, while eastward returns sometimes align better with natural circadian peaks. Studies compiled by sports science groups at institutions in North America and Europe demonstrate that these directional differences appear in aggregated box-score data rather than isolated anecdotes.
Documented Performance Metrics
Performance journals maintained by team staff and academic partners record specific changes in key indicators. Field-goal percentages in basketball drop by an average of three to five points in the opening game after a three-zone shift, and similar reductions appear in NHL shot accuracy during the first period of back-to-back road contests. Baseball data from multiple seasons indicate elevated strikeout rates and lower on-base percentages when clubs play their initial series after crossing the Rockies. Researchers at the Australian Institute of Sport have cross-referenced these figures with sleep-actigraphy readings, confirming that reduced rapid-eye-movement cycles correlate with slower reaction times recorded by league tracking systems.
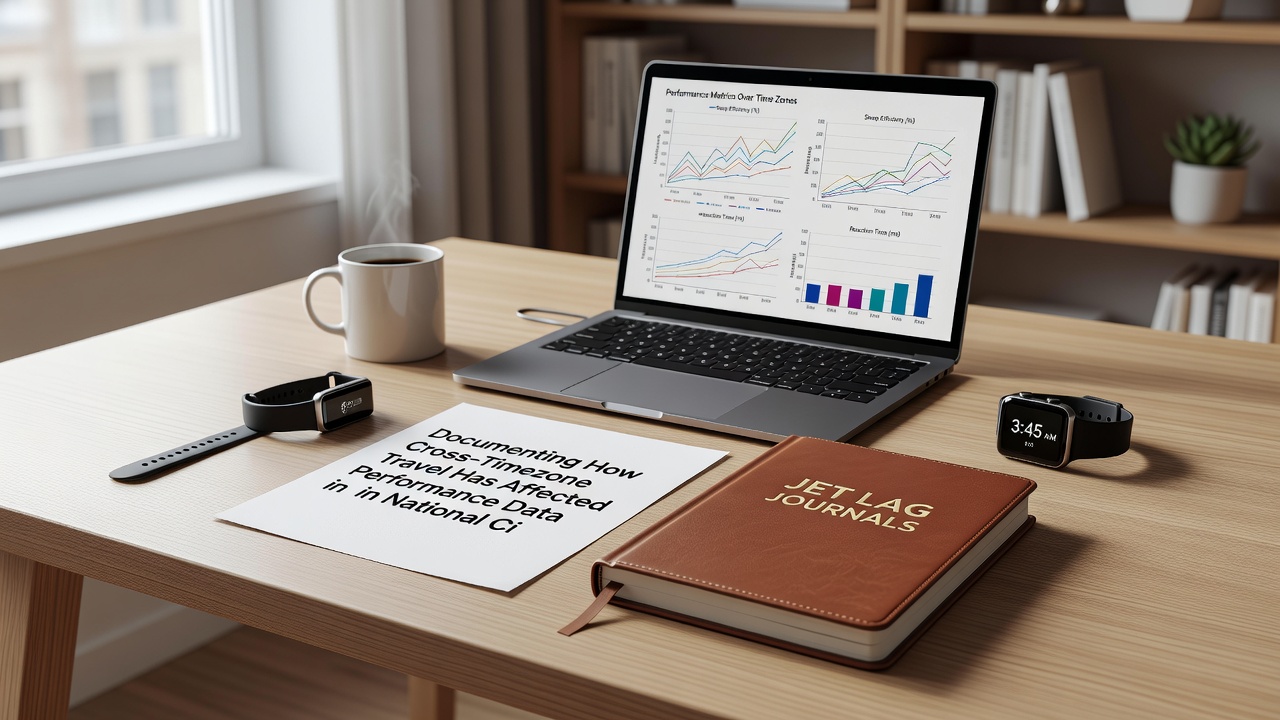
What's interesting is how certain positions show greater sensitivity. Catchers and goalies exhibit larger variance in error metrics during the adjustment window, whereas outfielders and wing players sometimes maintain closer-to-baseline sprint outputs. These position-specific patterns emerge repeatedly across seasons, prompting staff to adjust practice loads and recovery windows accordingly. Figures released by the National Institutes of Health in 2025 highlight similar circadian disruptions among shift workers, providing a broader context for the athlete-specific findings.
Monitoring Tools and Data Collection
Modern journals combine wearable devices, heart-rate variability sensors and GPS tracking to build granular records that update in near real time. Teams upload these streams to centralized platforms, allowing statisticians to flag anomalies within hours of a game. By August 2026, several leagues plan to integrate standardized jet-lag scoring modules that weight travel distance, direction and rest days against historical performance baselines. European sports federations already employ comparable systems during continental competitions, and North American circuits have begun pilot programs that mirror those protocols. The resulting datasets allow direct comparisons across basketball, hockey and baseball schedules without relying on subjective fatigue reports alone.
Recovery Strategies in Practice
Coaching staffs implement light-exposure schedules, adjusted meal timing and targeted training sessions to accelerate adaptation. Data logs indicate that teams using structured protocols regain baseline metrics one to two days earlier than those relying on unstructured rest. Canadian research centers have published case summaries showing that consistent application of these methods reduces the frequency of late-game performance drop-offs in cross-country series. Although individual responses differ, aggregate league statistics demonstrate a narrowing gap between home and road outputs when recovery windows receive deliberate attention.
Conclusion
Journals that pair travel records with performance data continue to refine understanding of how cross-timezone movement affects national circuits. As monitoring technology advances and schedules incorporate additional recovery considerations, the accumulated evidence provides clearer guidance for minimizing disruptions. Continued collaboration between league statisticians, academic researchers and medical staff supports ongoing refinement of these practices across all major sports.