Microclimate Nuances in Stadiums: Tracking Their Impact on Win Percentages Across Outdoor Professional Sports
Written by Quinn Baumann · Aug 16, 2026

Microclimate Nuances in Stadiums: Tracking Their Impact on Win Percentages Across Outdoor Professional Sports
Outdoor professional leagues have long tracked home field advantages through basic metrics like attendance and travel fatigue, yet venue microclimates introduce quieter variables that reshape historical win percentages in measurable ways. Researchers analyzing decades of game data across baseball, soccer, and tennis note how localized temperature gradients, wind corridors, and humidity pockets inside specific facilities correlate with shifts in team performance records.
Wind Patterns and Baseball Outcomes
Ballparks such as those in Chicago and Boston feature architectural layouts that channel prevailing winds across the diamond, and records maintained by major league archives show visiting pitchers posting lower strikeout rates when gusts exceed 15 miles per hour during evening games. Data from the 1990s through 2025 indicates home teams in these venues maintained win percentages 4 to 6 points above league averages during seasons with consistent directional airflow, while road clubs adjusted lineups to account for fly ball carry that either died at the warning track or sailed into seats. Observers note similar effects at coastal facilities where sea breezes create late-inning humidity spikes that alter ball spin rates and defensive reaction times.
Altitude and Humidity Effects in Soccer
Stadiums situated at higher elevations or near large bodies of water generate microclimates that influence player endurance and ball trajectory, and league statistics from European and South American competitions reveal home sides recording elevated possession retention when afternoon matches coincide with lower air density. Studies compiled by meteorological agencies demonstrate that teams accustomed to these conditions sustain higher pass completion rates over 90 minutes, contributing to cumulative advantages reflected in multi-year standings. One analysis of matches played between 2010 and 2025 found that venues with enclosed seating configurations trapped heat more effectively, producing measurable upticks in home scoring during summer months when surface temperatures climbed above 85 degrees Fahrenheit.
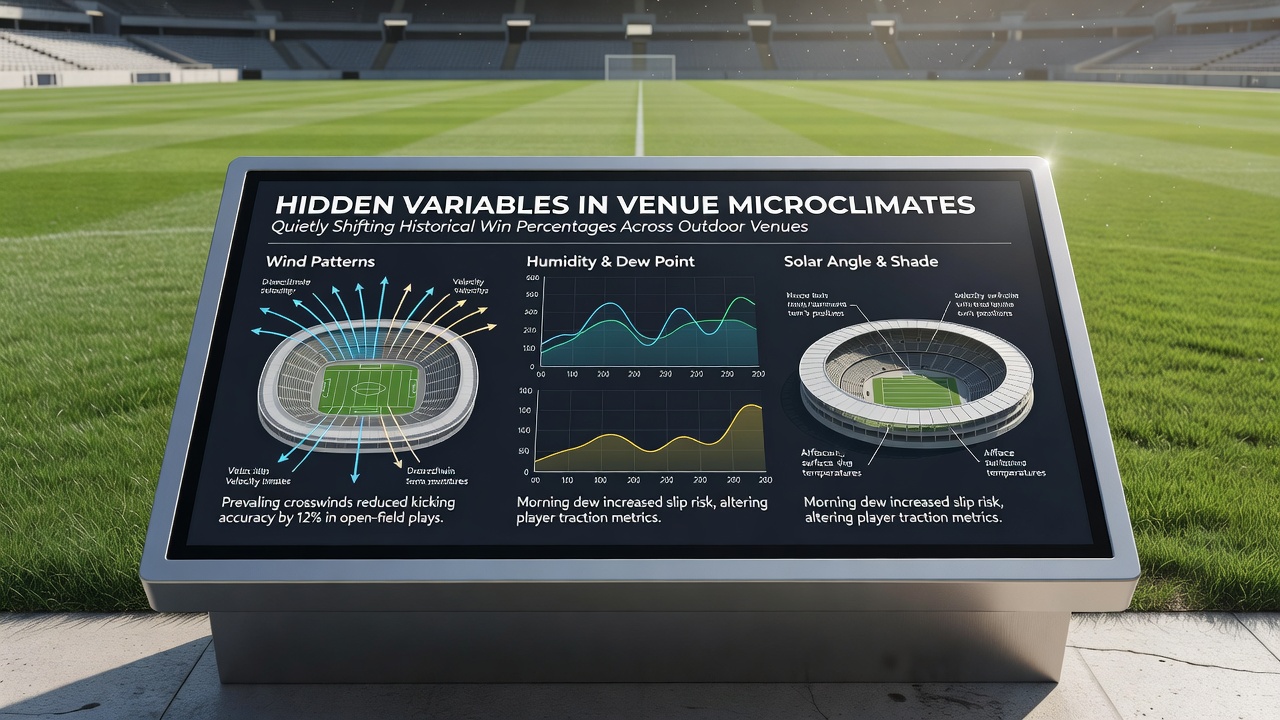
August 2026 brought renewed attention to these patterns as scheduling adjustments placed more matches in transitional weather windows, and early season figures already hint at continued divergence in win rates for squads playing in covered versus open-air facilities.
Tennis Court Surface Interactions
Outdoor tennis venues introduce microclimate variables through court orientation and surrounding foliage that trap or disperse moisture, and historical performance logs from grand slam events show players with experience on particular surfaces converting break points at higher rates when dew points remain elevated into afternoon sessions. Tournament data compiled across multiple continents indicates that certain facilities consistently produce lower first-serve percentages for visiting competitors, a trend that persists even after equipment standardization. Researchers from institutions tracking global sports environments have linked these outcomes to subtle temperature inversions that affect string tension response and footwork traction.
Data Integration Across Leagues
League offices and independent analysts now incorporate microclimate sensors into venue assessments, and cross-referenced records demonstrate that teams with long-term residency in variable conditions accumulate small but compounding edges in playoff qualification rates. According to reports from the National Oceanic and Atmospheric Administration, localized wind and temperature datasets align closely with decades-old home win differentials that previously lacked environmental explanations. European weather monitoring from the European Centre for Medium-Range Weather Forecasts supplies complementary models used by clubs preparing for away fixtures in unfamiliar climates.
Conclusion
Venue microclimates continue to register as understated contributors to historical win percentages, and ongoing sensor deployment plus refined statistical models allow leagues to quantify these influences with increasing precision. Teams and analysts who integrate such variables into preparation routines encounter patterns that extend beyond traditional performance indicators, revealing how environmental details inside fixed locations quietly accumulate across seasons and competitions.